Gender Pay Gap at Mooncup
The gender pay gap is back in the news here in the UK, with MPs calling for small businesses to publish their gender pay gap figures as well as the big companies.
The UK Government recently introduced compulsory gender pay reporting, and companies with 250+ employees must now report their gender pay gap data. The first year’s figures were reported in April 2018, and received a huge amount of coverage in the UK press, with the aviation industry attracting some of the worst criticism.
Now MPs are proposing that organisations with 50+ employees publish these figures too. At Mooncup Ltd. we’re still some way away from the 50 employee mark, but we thought it might be interesting to work this out anyway, just out of curiosity…
What do we mean by the gender pay gap?
The gender pay gap figures we see reported are, simply, the difference in the mean (average) earnings of all the women and all the men in an organisation. Just add up the hourly rate for all the women in your organisation and divide this figure by the total number of female staff. Then do the same for all the men and compare these two figures. The percentage difference is your organisation’s gender pay gap.
What do companies have to report?
From April 2018 in the UK, all companies of a certain size must publish and report the organisation’s:
• mean gender pay gap in hourly pay
• median gender pay gap in hourly pay
• mean bonus gender pay gap
• median bonus gender pay gap
• proportion of males and females receiving a bonus payment
• proportion of males and females in each pay quartile
“Gender pay gap reporting: make your calculations” gov.uk website (2017)
Rather than just reporting a single percentage, publishing this range of data allows us to analyse just how the system operates and could be a first step in working out how to make meaningful change.
For example, the mean pay for one gender can be artificially inflated by a handful of high-earning individuals at the top, i.e. if one of the women working for the company is on the board of directors (or one of the men), her (or his) pay would still bring up the average (mean).
However, publishing the median pay figure will tell you about the distribution of wages within a company. If you lined up everyone according to their hourly rate, the median would be the value that is right in the middle, and can often give a better indication of the experience of an “average” employee. The closer the median is to minimum wage, the more low-earning individuals you can assume to be at the base of the pay “pyramid”.
The Financial Times has an insightful article on how to analyse pay gap figures: “What is the best way of measuring the gender pay gap?”
(By the way if you’d like a refresher on the different kinds of averages, I highly recommend the BBC’s GCSE Bitesize page which helped me out a LOT! 🙂 )
Why does the gender pay gap still exist?
It has been illegal since 1970 for employers in Britain to pay men and women different amounts for doing the same job. So why does the pay gap between men and women still exist, when women have equal rights and have been in the workforce for at least 50 years? It’s complicated, and lots of brilliant organisations do a far better job of explaining it than I can:
The Equality Trust is a helpful reference for analysis and figures about inequalities of all kinds.
The Office for National Statistics (ONS) holds ALL the statistics (ever) and provides some insightful gender pay gap analysis for the UK.
Full Fact is the UK’s independent fact-checking charity and they have run a fact check on the claim “Women earn less than men in the UK”
The Women’s Equality Party has done some great campaigning around equal pay for women in the UK.
More than just your hourly rate
The age distribution of the pay gap is very interesting: as has been widely reported, the gap for full-time workers remains small at younger ages… however from age 40 onwards the pay gap widens, reaching its peak between ages 50 to 59. You can read the full report: “Understanding the gender pay gap in the UK”, ONS 2018.
The Financial Times also reported on this in 2018: “Gender pay gap almost gone for UK women in their 20s”.
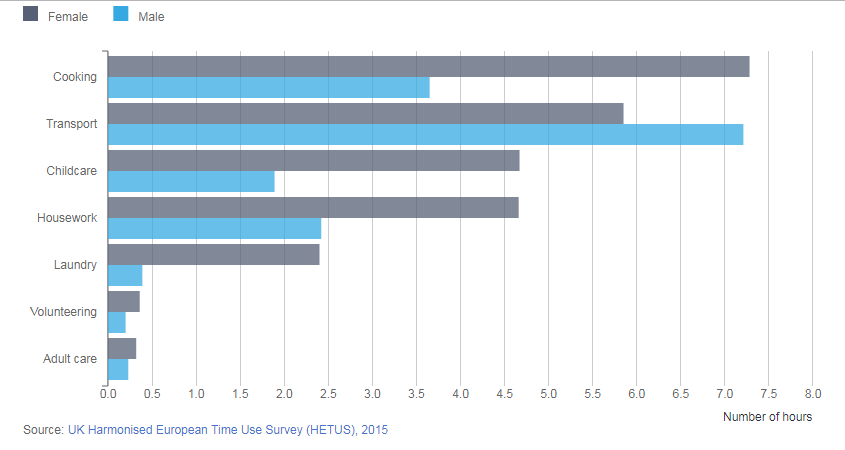
Other things to consider are that these figures focus on the hourly rate for female and male employees. Women are still more likely to work part-time in order to care for children and older relatives, and deal with cooking, housework and laundry (yes, still!)
According to the Office for National Statistics,
“36 to 45 year olds carried out the most unpaid work, with this category putting in 27.40 mean hours per week of unpaid work, followed by 26 to 35 year olds. (…)
However, 26 to 35 year old women delivered the most unpaid work of any other age category, putting in 34.60 mean hours of unpaid work a week.”
This graph, taken from the UK Harmonised European Time Use Survery 2015, shows how women carry out an overall average of 60% more unpaid work than men: Women shoulder the responsibility of ‘unpaid work’, ONS (2016).
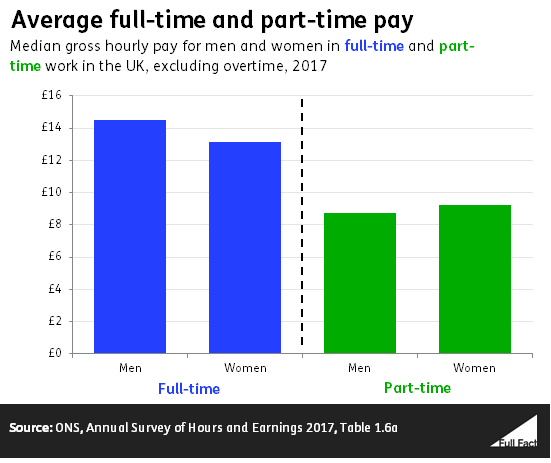
Pay inequality isn’t so one-sided though. Here’s another graph taken from the ONS Annual Survey of Hours and Earnings (2017), showing median gross hourly pay for men and women in full and part-time work
This sttudy showed that female part-time workers tend to earn a higher hourly rate than male part-time workers – perhaps suggesting a bias against men in part-time work and an expectation that men will work full time?
The gender pay gap is shrinking (but definitely still there)
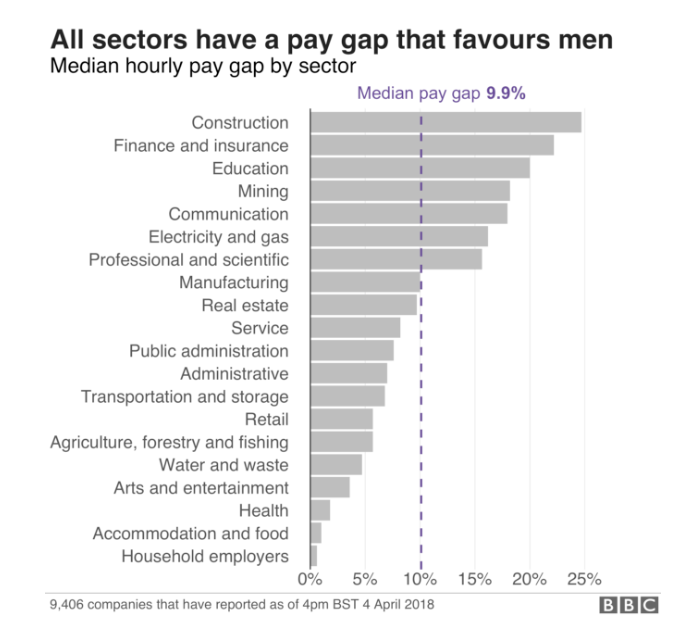
The bad news is that all sectors still have a gender pay gap in favour of men. The good news is that it is shrinking:
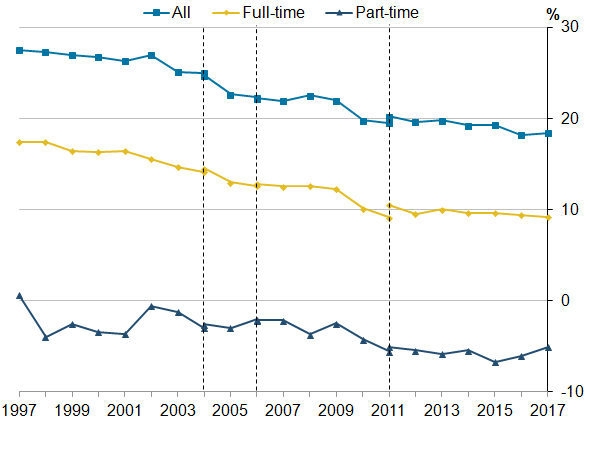
Gender pay gap for median gross hourly earnings (excluding overtime), UK, April 1997 to 2017. ONS Annual Survey of Hours and Earnings: 2017, Figure 6
What does the gender pay gap look like at Mooncup Ltd.?
As you may have guessed the workforce at Mooncup Ltd. is mainly female – made up of sixteen women and two men. Our three company Directors are women, and so are our specialist Mooncup Advisors. Our Financial Director and our Bookkeeper are both women, and our IT Support is a man, but they are not members of staff, so we didn’t include them in our calculations.
After playing with some basic Excel formulas and casting our minds back to our GCSE maths lessons(!), we were pleased to find that the mean pay differential at Mooncup Ltd. is 1.56% in favour of women.
However, the median pay differential between men and women is 12.5% in favour of men.
Mooncup Ltd. only has two male members of staff out of a total of 18. With numbers this low, the next person we hire could change these results completely! Please keep checking the website for vacancies. Mooncup Ltd. is a great place to work and an equal opportunities employer! 😉
Mooncup Ltd. is one of just 14% of UK companies* that pay women more than men.
(*of UK companies who declared their figures in April, with 250+ employees)
It’s not just about the gender pay gap…
Of course, there is so much more to pay inequality than the gender gap. It’s 2018 and we know that gender is but one aspect of inequality. The boardroom pay debate (the differential between the highest and lowest paid staff in an organisation) rages on.
Class, ethnicity, disability, family background – all of these things and more are still powerful predictors of an individual’s chances of success in this life – on a material wealth level, I mean. And that’s just for those of us eligible to live and work in the UK.
It’s great that the gender pay gap is in the spotlight, but we would love to see an intersectional study on pay differences too. Until then, some recommended reading is The Spirit Level: Why More Equal Societies Always Do Better (Kate Pickett and Richard Wilkinson, 2009):
“It shows that for each of eleven different health and social problems: physical health, mental health, drug abuse, education, imprisonment, obesity, social mobility, trust and community life, violence, teenage pregnancies, and child well-being, outcomes are significantly worse in more unequal rich countries.”
As of September 2012, the book had sold more than 150,000 copies in English. It is available in 23 foreign editions.
The Spirit Level: Why More Equal Societies Almost Always Do Better, The Equality Trust (2009)


It looks like you’re accessing our site from the US.
Mooncup® the original silicone menstrual cup
is called MCUK® in the US.
Take me to the MCUK website.
MCUK (‘Mooncup UK’) has all the ethics, quality and customer service associated with the Mooncup® and is different only in name.